What is Express Performance?
Express Performance (EP) is a new system developed by the Express Travel Group (ETG) exclusively for use by its agency members. The system is designed to accomplish the following:
- provide a platform for agency owners to instantly retrieve product sales data as reported by partner suppliers to ETG;
- enable agency owners to set a yearly profit goal for their agency and;
- Manage this profit goal with a simple monthly update of their agency sales data.
Why is ETG introducing this new technology?
EP was developed to drive data based productivity improvements across the network.
It will be the agency's source of supplier reported sales that are transacted by that agency.
Some of the key benefits to members will be:
- Measuring staff performance using the scientific method
- Evidence based promotional activity
- Assisting suppliers to drive advertising campaigns for members
- Target incentives
- Benchmarking of suppliers, and understanding each supplier's relevance to the network
- Determining if ETG is missing a niche supplier or product
- Review of preferred partners to ensure ETG have the "right mix"
- Motivating consultants through consultant awards
- Calculating Agency of the Year
- Reviewing cost of business data
Future benefits of EP will be the incorporation of benchmarking data across the group as well as some key performance indicators such as "cost of seat" calculations plus "Agency of the Year" metrics.
What access will ETG have?
Each Business Development Manager (BDM) will have access to the data of their specific accounts only. They will be tasked with helping business owners and managers review their data and assist at ways and methods of improving profitability within your business.
How will ETG use the data?
ETG will use the data to help guide future policy, strategy and direction for the network. It will have greater understanding about the needs of its members and be able to facilitate and distribute those learnings to them through Express Academy, marketing activity, conferences and meetings, I.T. development, Business Development Managers etc.
Getting started
Login to the Member Platform:
- italktravel
- http://www.italkagents.com.au
- Independent Travel Group
- http://www.independentagents.com.au
- Select Travel Group
- http://www.selectravelgroup.com.au
Due to the sensitivity of some of the data, only Agency Owners / Authorised Managers as identified within our system will have access to EP. Please ensure your Member Platform login details are not shared with your staff. If you need to change your password please follow these instructions.
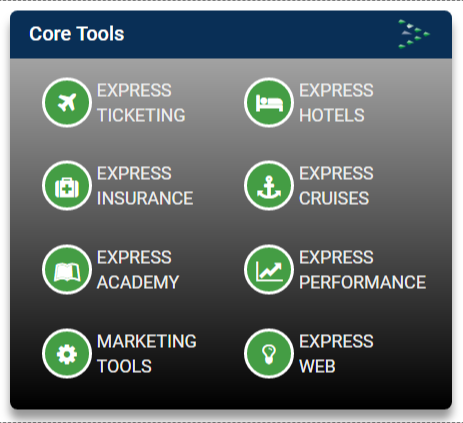
Click on the Core Tools link
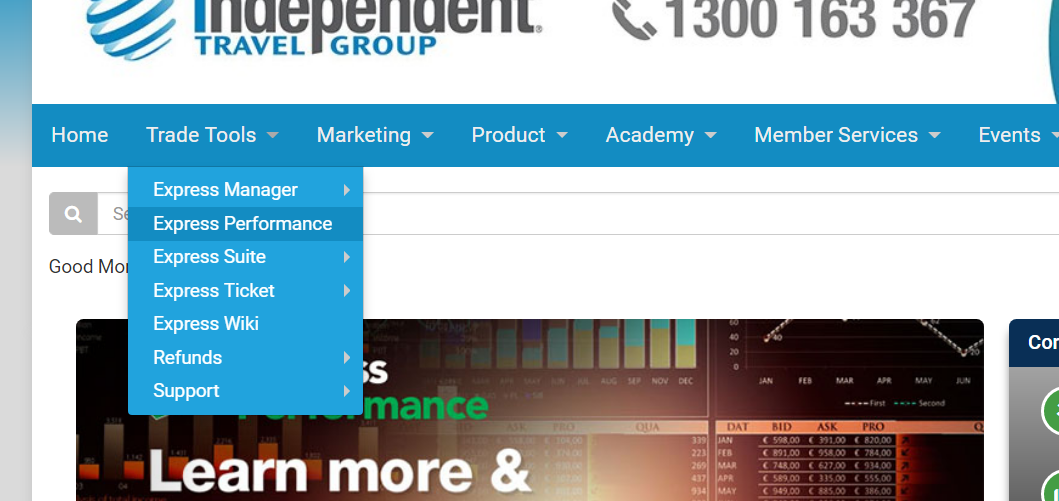
OR Click on the menu Trade Tools, then select Express Performance
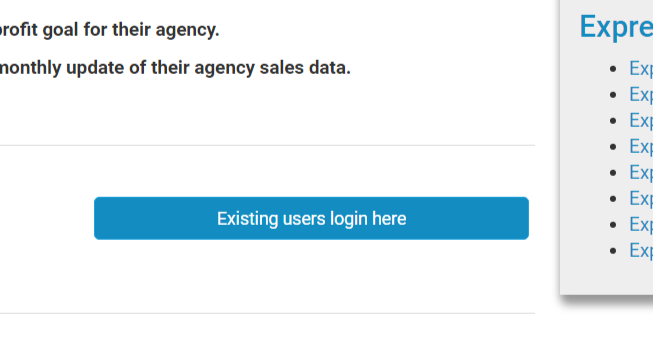
Then scroll down part of the page and you will see a blue button marked with "Existing Users Login Here". Click this button to be taken to Express Performance
Login using the username and password credentials provided. In most cases your username will be your registered (agency) email address.
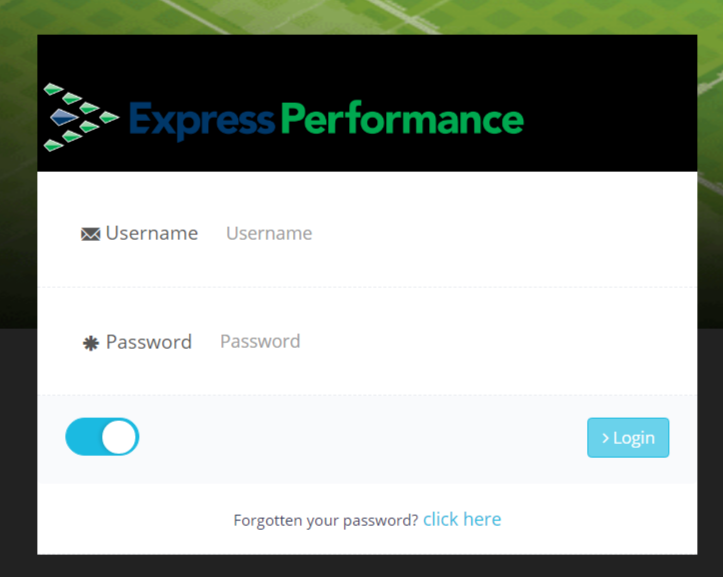
If you are unsure, or have forgotten your password, you can recover it by clicking on the "forgot password" link at the bottom of the login screen, entering your email address (or username if it is not an email address) and pressing submit.
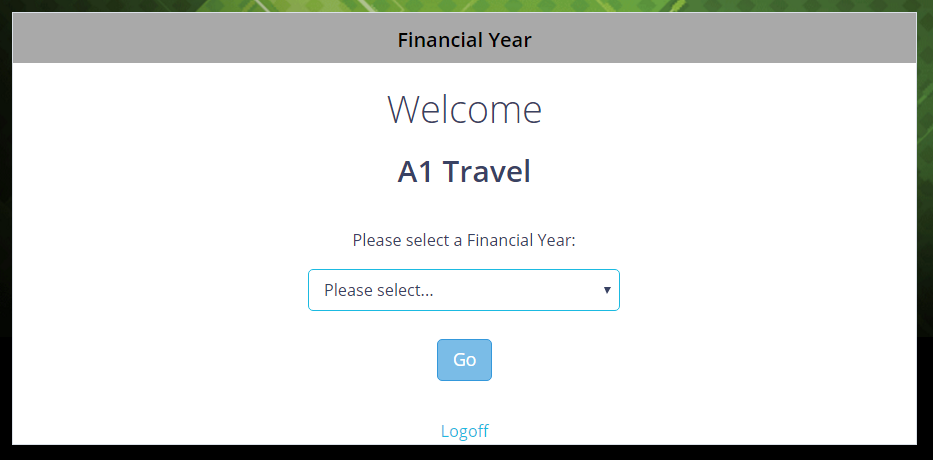
Starting a new financial year
When first accessing EP you will be required to "Start a New Financial Year".
-
In the drop down box, "start/select a new Financial Year", select from the Financial Year's available.
There will be no data showing in the "Agency Staff Performance" and "Agency Total Gross Sales" screens until you commence entering your agency's staff details and sales data within the system. How this is done will be explained in this document.
There may also be no data visible in the Product Sales area until all applicable period data has been uploaded by the ETG Analyst Team as provided by our partner suppliers, OR if your agency has not sold any preferred partner product OR our partner suppliers do not have your agency registered within their system – please contact your ETG Business Development Manager if you believe this to be the case.
Working with an existing financial year
Most of the time you will be accessing an existing Financial Year within EP.
To access an existing Financial Year, at the home screen select from one of the existing Financial Year's in the "Please select a Financial Year" drop down box.
You will then be taken to the Dashboard Screen.
The menu bar
The Menu Bar is visible and always accessible within EP. By clicking on the desired 'button' on the Menu Bar, you will be taken to that appropriate screen.

Help and Password Change
To access this help file at any time, click on the "How To" button.
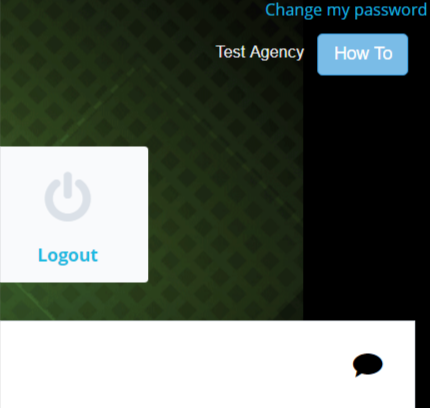
Whenever you see the "speach bubble icon" , by clicking on it you can access specific information direct within this document that relates to the items you are looking at. If the speach bubble is the colour blue this references an external link.
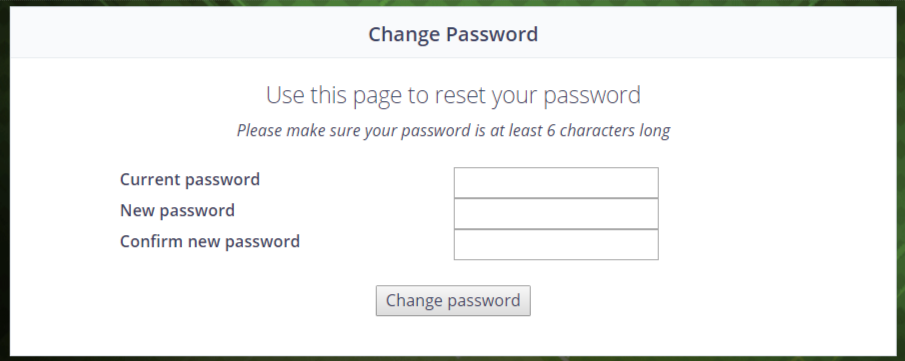
To change your password, click on the "Change Password" link at the top right that is available on every page. You will then be taken to an alternate screen where you will need to enter your current password once, and enter a new password and confirm it. The new password needs to contain at least one number, one uppercase character, one lowercase character and be at least 6 characters in length.
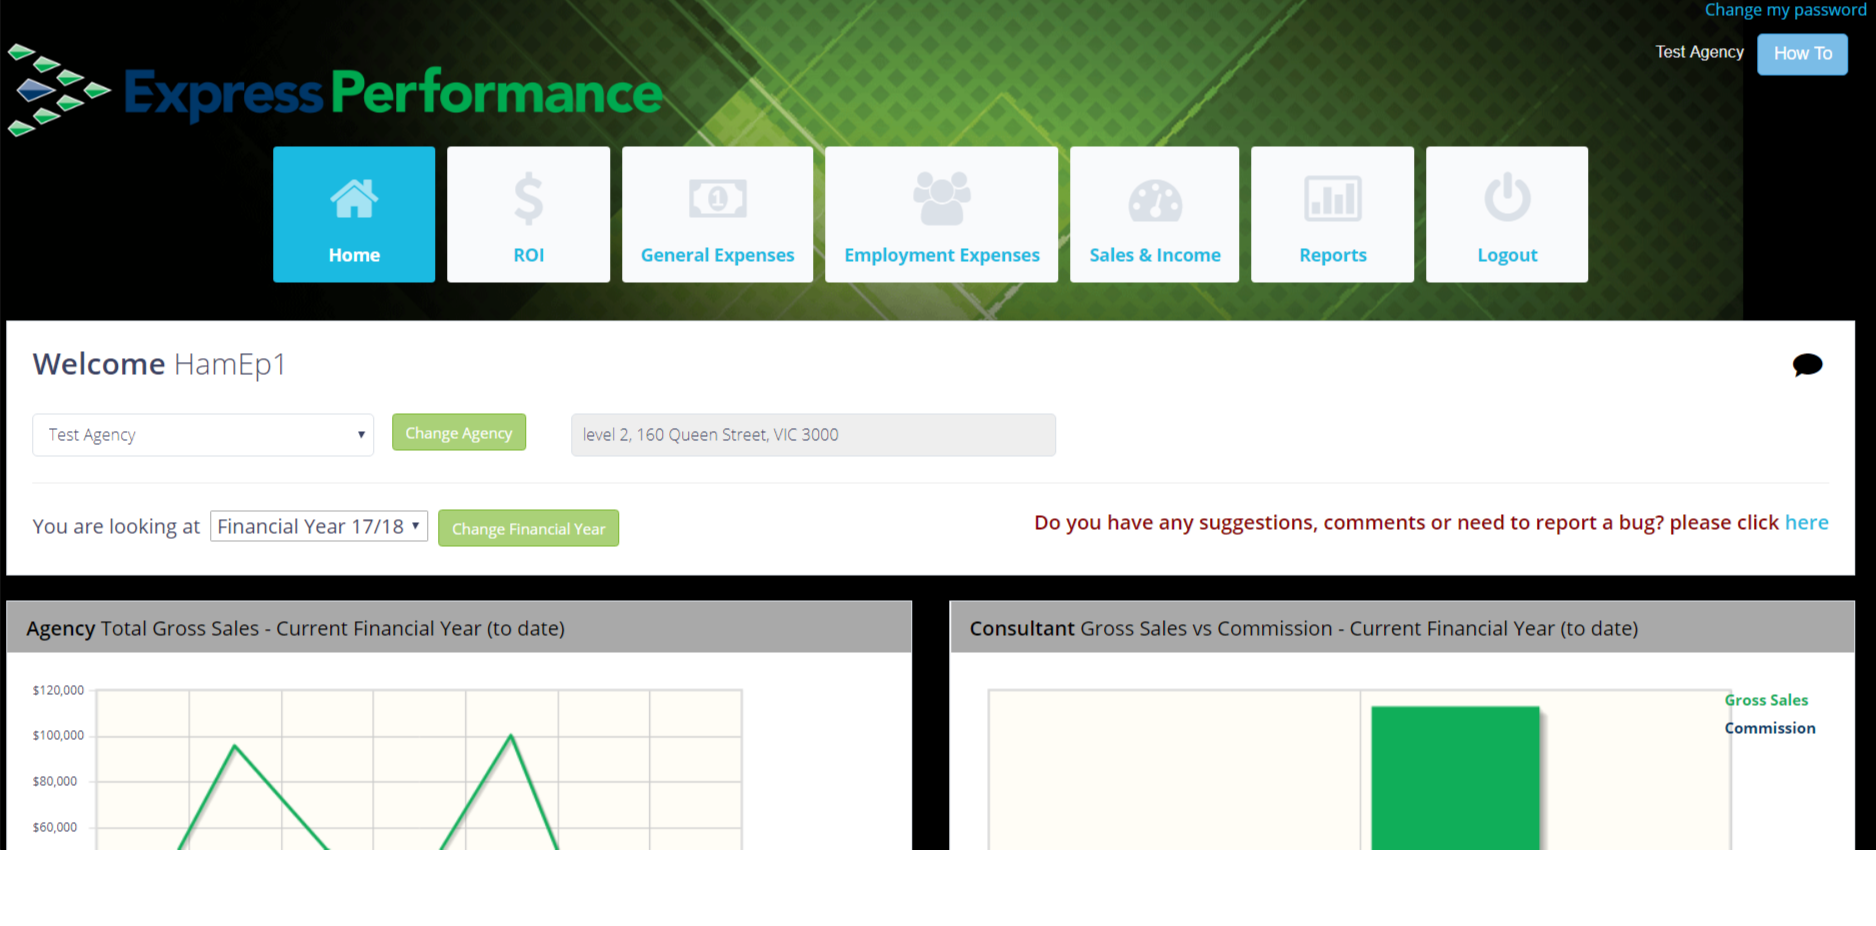
The dashboard screen
After selecting the appropriate Financial Year the system will display a screen similar to the following.
The Dashboard Screen is divided into a series of sections each displaying different types of information that either has been obtained internally via ETG (Product Sales Data) or information that has been entered by your agency. Let's have a closer look at the sections relating to the Dashboard Screen.
These charts and graphs are dynamic as all values will change as sales data is uploaded every month (or quarter) by ETG. As you enter sales data for your consultants, any related chart values will also adjust simultaneously.
Agency details
The Agency's main details are shown here plus the Financial Year that has been selected. Data displayed and entered will relate to this period.
Actual values may not be shown for reasons of confidentiality (ie. in a situation where your agency staff may have visibility of your screen while you are working within Express Performance).
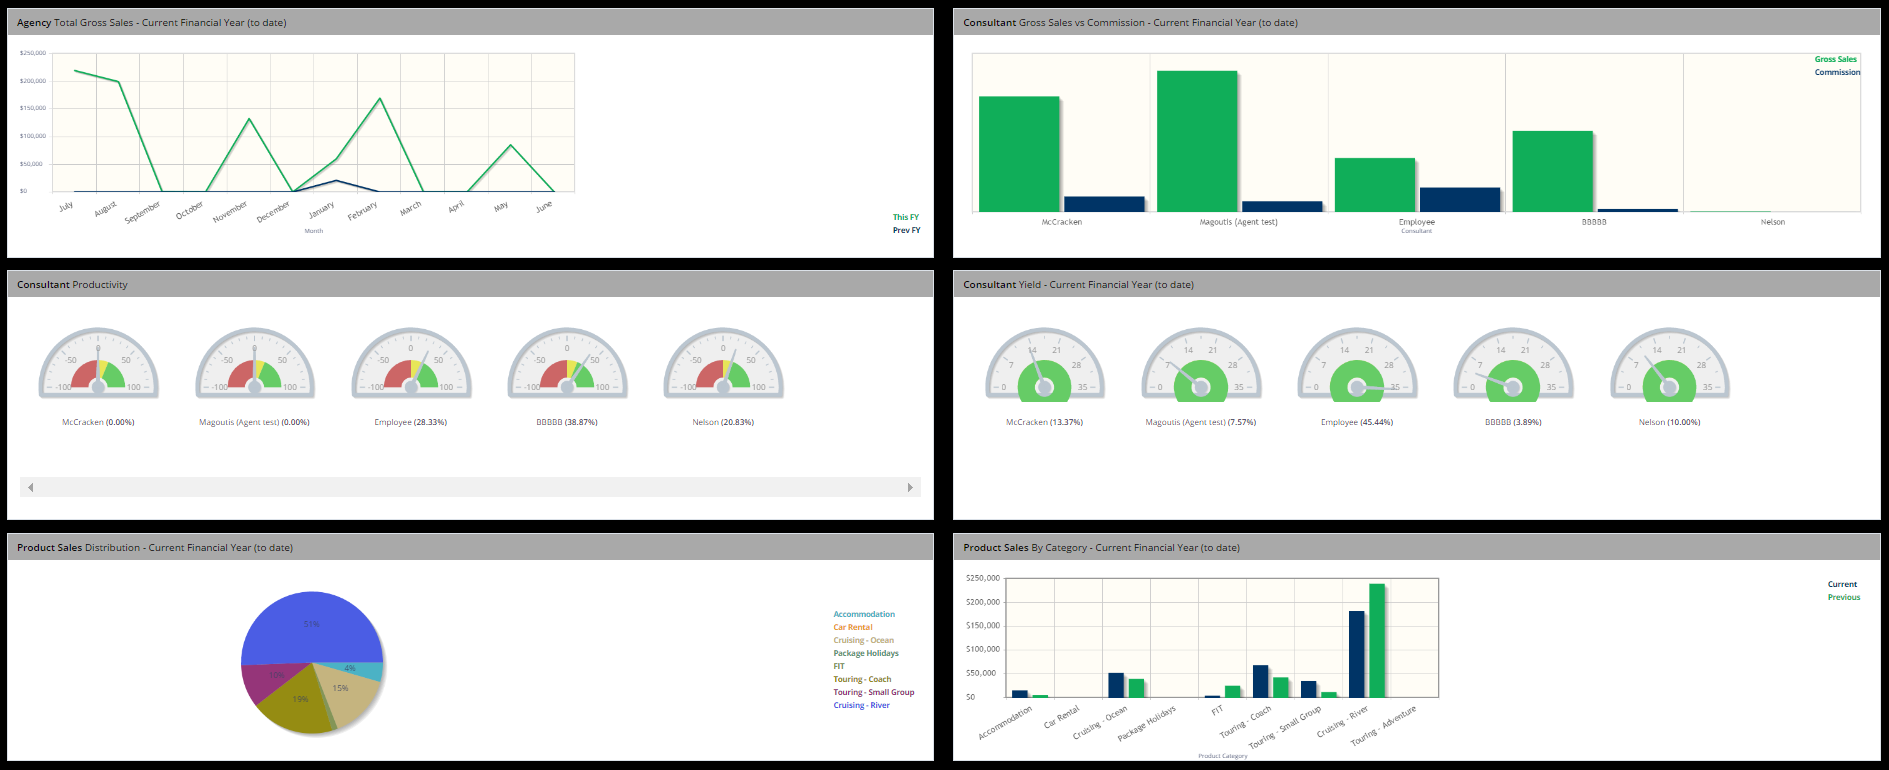
Agency Total Gross Sales - Current Financial Year (to date)
This line graph shows the agency's total sales performance details on a monthly basis. Air, Land, Insurance and Cruise sales are summed each month for all consultants. A comparison with the previous Financial Year (if available) is also displayed. By hovering over the line graph you will see the actual dollar amount for each month.
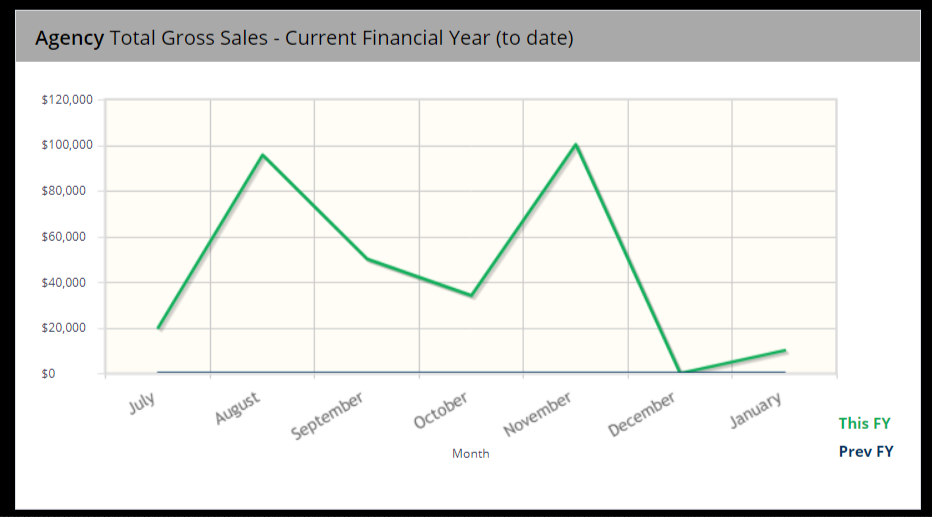
Consultant Gross Sales vs Commission - Current Financial Year (to date)
This bar graph displays the total Air, Land, Insurance and Cruise gross sales and the corresponding total commission earned from these same product segments for each consultant in your agency.
Gross Sales – sales including Point of Sale (POS) commission, all fees, taxes etc.
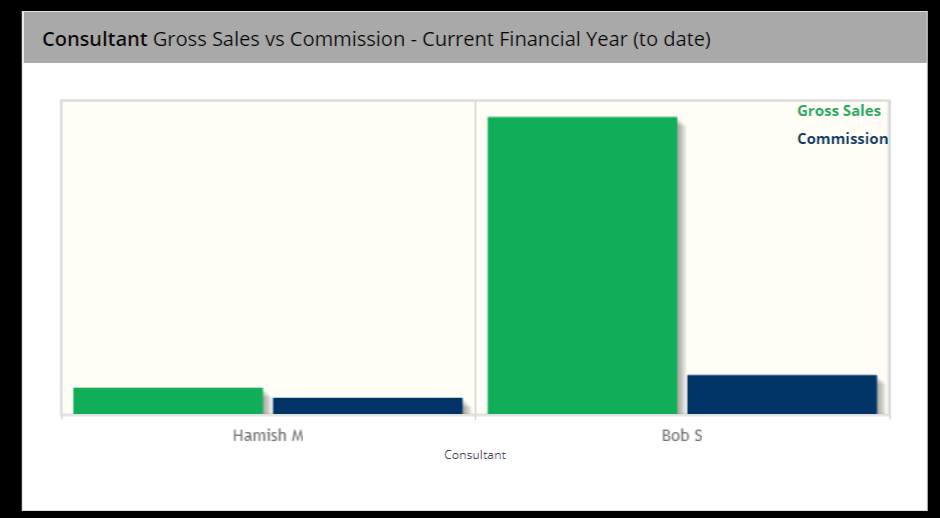
Consltant Productivity
This meter gauge graph shows a red area where the employee is not as productive as required by the business variables (generally costs). The yellow area shows that the consultant is above cost of seat and producing well for the business. The green area shows the employee is highly efficient and has EXCEPTIONAL output.
If the consultant is not meeting their Cost of Seat, the gauge will be in the red zone. If they are just on their Cost of Seat, the gauge will point to "0" (zero) and be in the yellow zone.
The gauge represents output over time as a function of Cost of Seat.
If the employee's Cost of Seat was $1,000 a week (assuming all their time was allocated to selling) and they produced an income of $900 during that time, then they would be shown in the red zone.
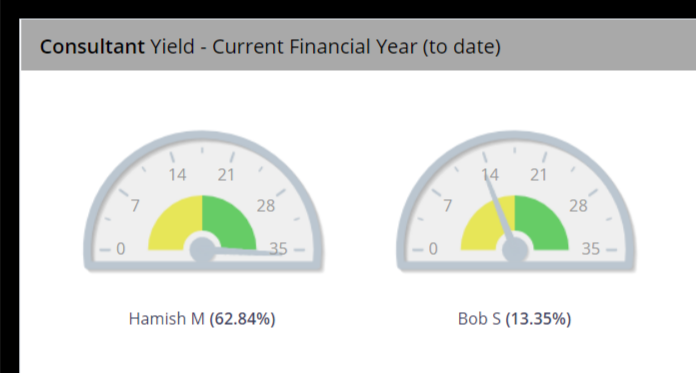
Consultant Yield - Current Financial Year (to date)
The yield for each consultant in the agency is calculated as the ratio of his/her total gross sales to his/her total commission for the current financial year to date. This graph shows those yields for each consultant utilising the values shown in the preceding graph "Consultant Gross Sales vs Commission - Current Financial Year (to date)".
The next sections on the dashboard shows eligible product sales data as provided to ETG by partner suppliers and entered by the ETG Analyst Team.
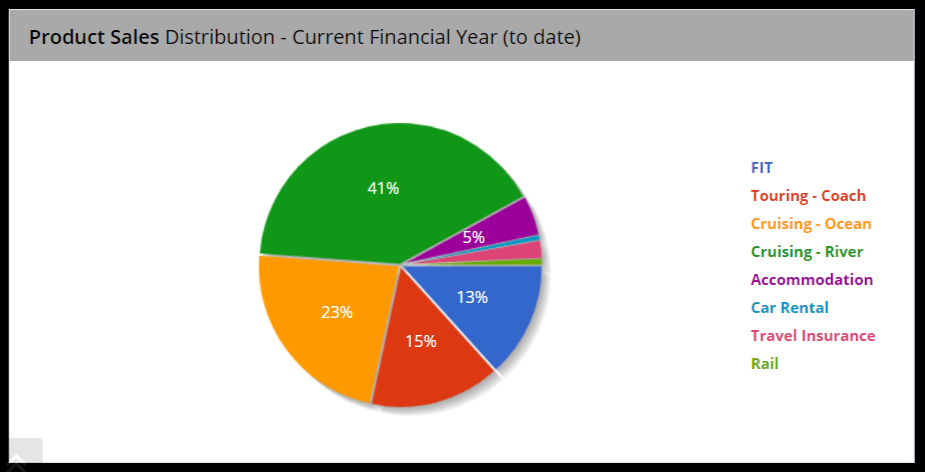
Product Sales Distribution - Current Financial Year (to date)
Each supplier product is allocated a product category within EP. The pie chart shows how product sales are distributed across your agency.
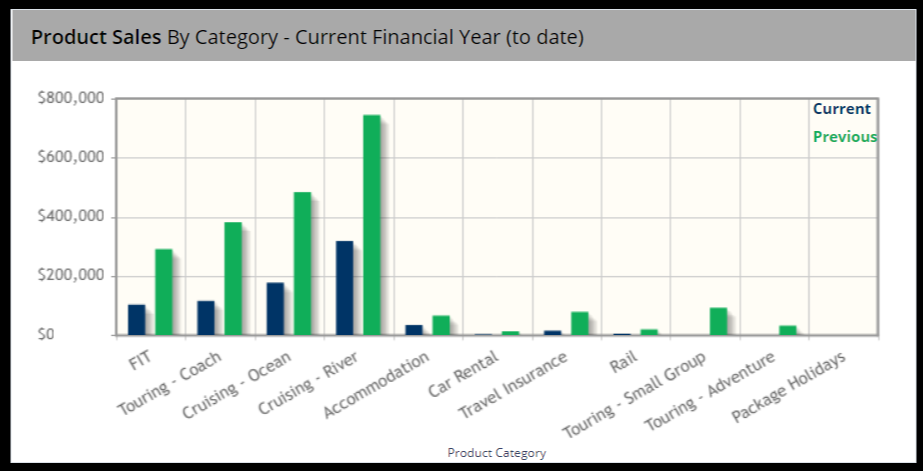
Product Sales By Category - Current Financial Year (to date)
Eligible product sales for your agency in the given financial year (to date) are summed and displayed within the product categories relating to each supplier product. You will also see how the Product Sales Data for the current year compares to the previous year for each product category.
The Return On Investment (ROI) Screen
One of the main reasons EP was developed was so our agency partners could quickly reference their profitability and track their financial goals. We understand members may be using their own accounting software and mid-office systems to achieve this, and by no means is EP an accounting or mid-office system, nor is it a replacement for these systems, however, the aim is to create a mechanism to deliver information on the individual and collective back to the you, the agency owner.
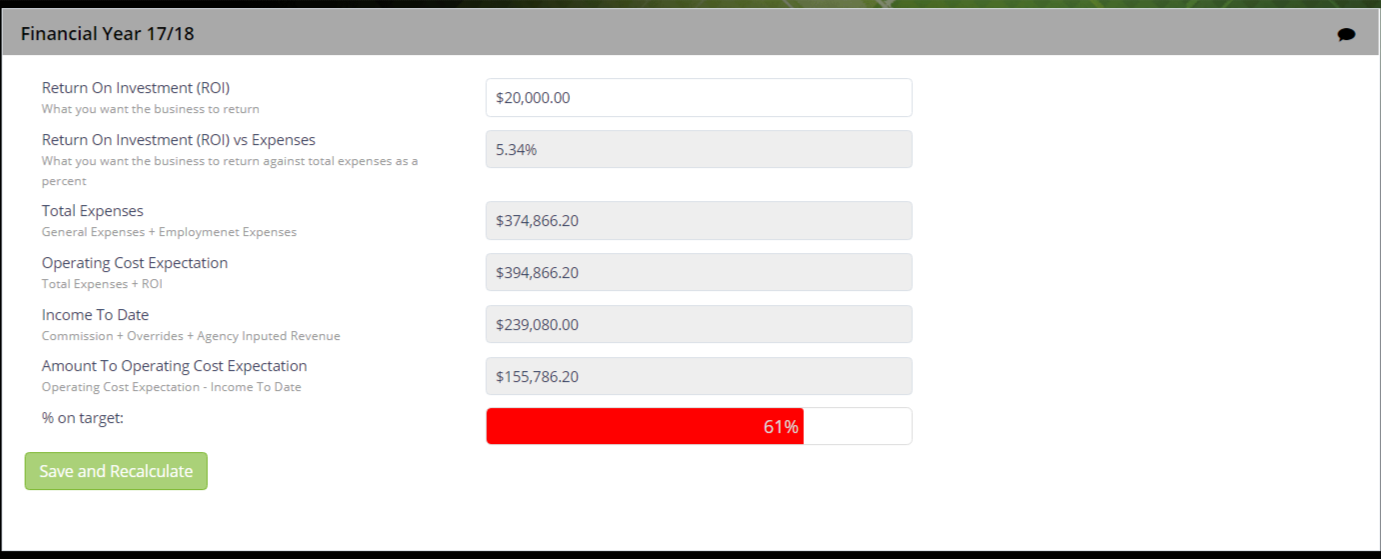
Within the ROI screen, an agency owner / manager can set their expected profit goal, or Return on Investment (ROI), for their agency for the year. This ROI should be considered budgetary.
If you draw a salary from the business, the ROI may be quite minimal, however if your agency is an investment (i.e. you obtain a share of the profit at year end), this target may be higher. In setting a ROI you might want to include items such as:
- Investor dividends
- Office renovations / repairs / refits in following years
- Emergency funds and cash flow management
- Unforeseen expenses
The above list is not exhaustive. Your reasons for a profit goal /ROI should represent ways to prosper and protect your business and lifestyle.
ROI within EP is defined as retained income less costs and does not take into account taxes payable on your profit as this may be handled differently amongst business owners according to their situation and corporate structure.
Enter your ROI in the space provided and then click on "Save and Recalculate" at the bottom of the page.
As values are entered within EP during setup (see next sections) and throughout the financial year, you will notice that the values within the ROI screen will also change.
The "% of target reached" progress bar will change accordingly. This is a quick and accessible indicator as to how close your business may be to your objectives.
Download our handy "lifestyle calculator" by clicking on the button below. This tool may help you understand what ROI would be appropriate for lifestyle requirements.
The General Expenses Screen
Within this section all expenses relating to your agency are entered. To make it easier, these expenses can be entered for any period (weekly, monthly, quarterly etc.) and EP will annualise these amounts for you.
The expense figures entered here should be budgetary, meaning that they are what you forecast the business to spend.
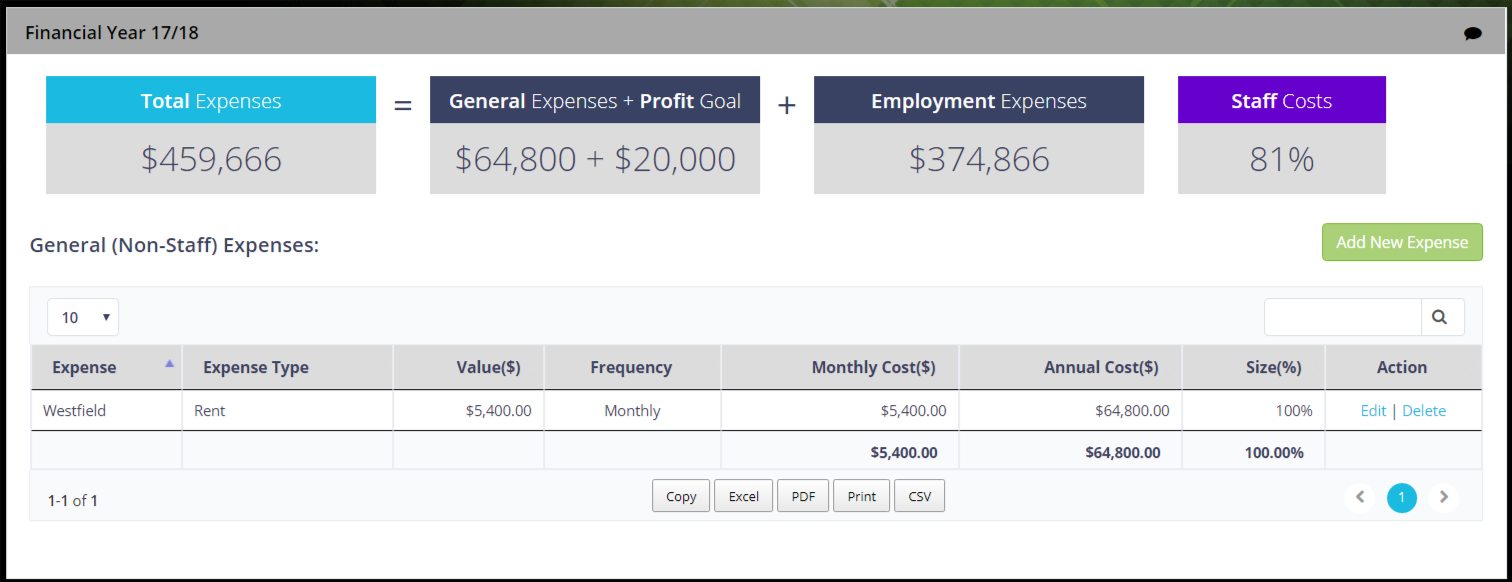
Look at your previous years Profit and Loss statement and use that as a guide. The more detailed you are, the better the data output will be.
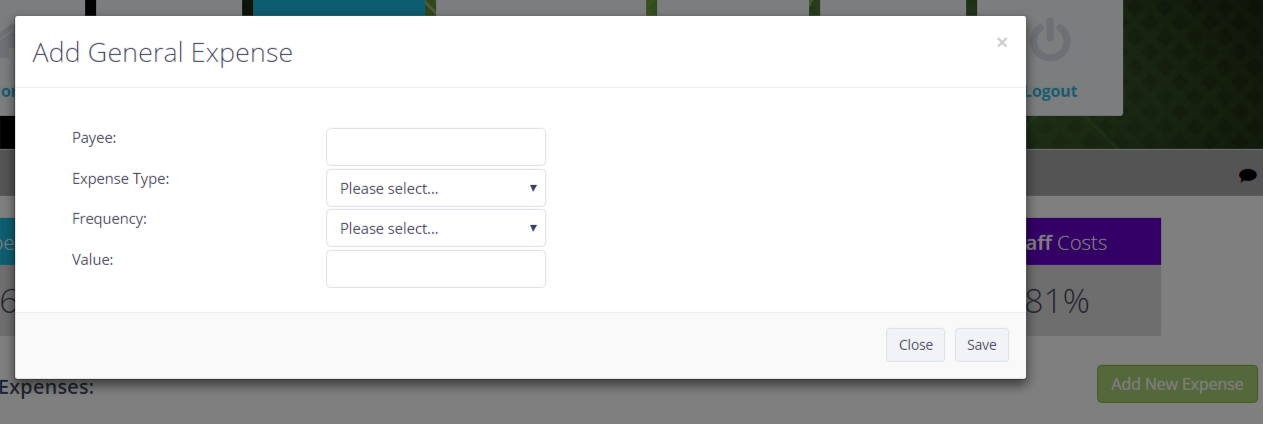
Add an expense
- Click on the "Add New Expense" button
- Enter Payee Name (e.g. Westfield)
- Select the Expense Type from the drop down box list (e.g. Rent). If there is no obvious category choose "Other Fees"
- Choose the Frequency of payment (e.g. monthly payment)
- And finally enter the Value (enter values inclusive of GST as this, invariably, is a cost)
- Click Save
You should now see the Expense item on the list showing the values you entered plus the derived "monthly" and "yearly" cost as well as the size of this expense in percentage to the overall expenses you will enter for your agency.
You do not need to do this every month for every invoice you receive! For example, if you know your internet costs are $79.95 per month, you only enter once for that financial year.
If an expense item should increase during the year for whatever reason, you can go back and adjust this item by clicking the Edit button.
If you make a mistake and need to remove an expense item, click on the Delete button relating to that expense.
Edit an expense
While on the General Expenses screen you will notice next to each expense item an "Action" column.
- Click the link "Edit" against the appropriate expense item.
- The selected expense details will appear in a form.
- Enter the changes you require.
- Click Save.
You will now see your adjusted expense item details on the list.
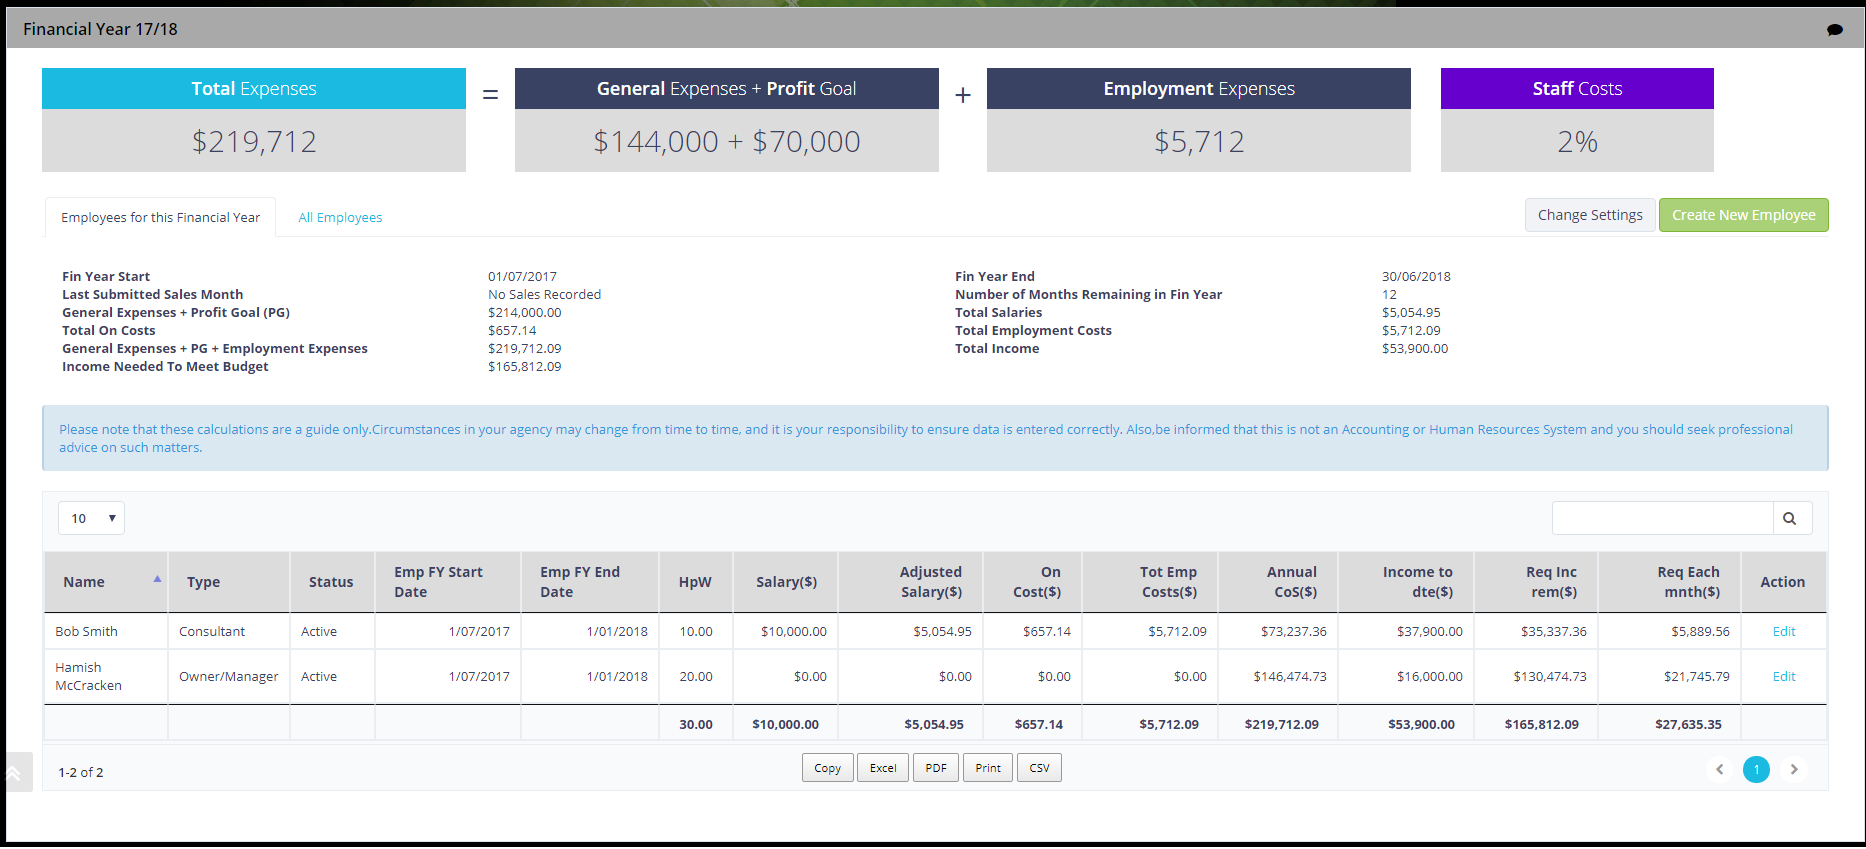
The Employment Expenses Screen
The Employment Expenses area is where staff salaries or wages are entered at the commencement of a new financial year. These values may be adjusted throughout the year as required.
Changing employment settings
By clicking on the "Change Settings" button the following value may be adjusted:
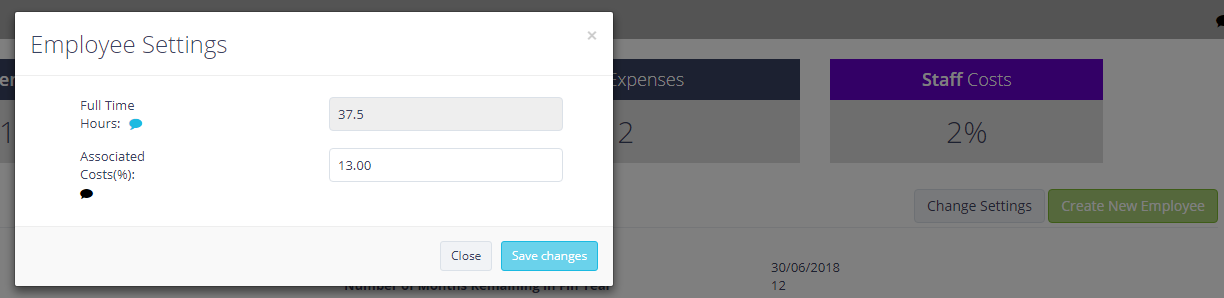
- Full Time Hours
- This field is not editable. It has been set by Fair Work Australia and is used to prorate consultants fairly across the network. "Full time hours" are 37.5 hours per week considering Monday to Friday, 9am – 5:30pm allowing for a one (1) hour lunch break. Fair Work Australia describes working hours.
- Associated Costs (%)
- Expressed as a percentage, these are further costs associated with salaries (e.g. Superannuation, payroll tax, leave loading etc.) As a general guide, you could expect on costs to be around 12-13% of the employee's salary. This is the percentage figure you would put in this field.
When employing new staff there are many hidden costs that are not always factored. Some employment costs to be considered are:
- Salary
- is normally quoted as the basic pay excluding any costs such as superannuation.
- Superannuation
- The employer must pay a set amount of superannuation for all employees using certain criteria. To find out more, visit the Australian Taxation Office website for more information.
- Annual Leave
- is normally 4 weeks per annum. To get an annualised cost of employment you need to include the annual leave cost at 7.69% (4 weeks / 52 weeks).
- Public Holidays
- There are usually 10 public holidays in Australia per annum. See gazzetted public holidays. Add 3.85% (2 weeks / 52 weeks).
- Sick Leave
- Most awards allow for 10 days sick leave per annum. See Fair Work Australia website for more information. Add 3.85% (2 weeks / 52 weeks).
- Workers Compensation Insurance
- This can vary broadly depending on the risk of the industry. The rate is fixed each year by statute and cannot be negotiated. To check the current rates visit Safe Work Australia website.
- Payroll Tax
- This is a state government tax that is levied once your annual payroll (including super) exceeds a certain threshold. The rate and threshold varies slightly for each state. For information around Payroll Tax visit Payroll Tax Australia's website.
- Recruitment
- Recent surveys suggest that recruiting a base-grade employee can be as must as $5,000. This can include the recruitment cost itself as well as down-time and training.
- Training
- This may include attendance at events or conferences, cost of subscription to online programs, tutorial or teacher driven resources.
Cost of Seat / Employment Expenses Table
The most important criteria here is that the data is used to calculate your overall agency expenses, very useful for the ROI calculation.
The data shows the "Cost of Seat" calculation based on all your entered expenses, profit goal and employee data.
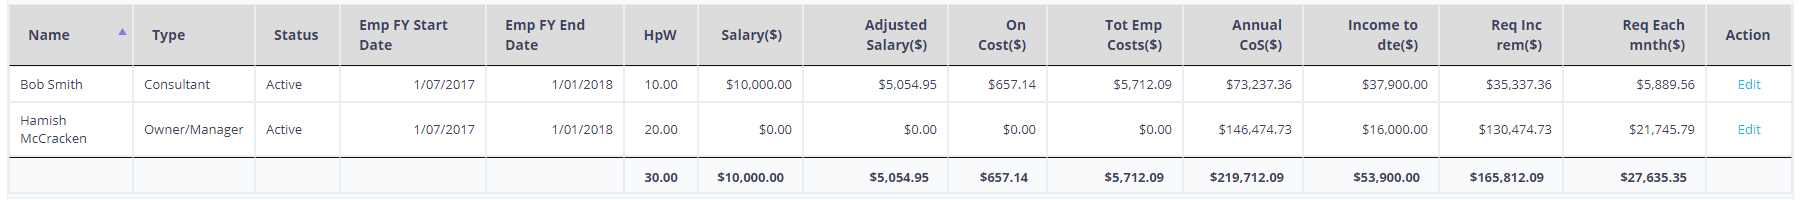
The columns on the above table represent:
- Name
- Employee's name
- Type
- Work function of the Employee (note that this is not the job/position title)
- Status
- If the employee is currently active/employeed in the business and taking a wage
- Emp FY Start Date
- Employee start date for this financial year. Allows for employees to work part of the year.
- Emp FY End Date
- Employee end date for this financial year. Allows for employees to work part of the year.
- HpW
- Selling Hours per Week
- Salary
- Annual salary
- Adjusted Salary
- If the employee is only working part of the year (defined by the Emp FY Start Date and Emp FY End Date columns) this column will be adjusted to reflect that time period.
- On Costs
- percentage of Associated Costs (%) x Adjusted Salary (this information is gathered from the settings dialog box discussed above)
- Tot Emp Cost ($)
- On Costs ($) + Adjusted Salary
- Annual CoS ($)
- Annual Cost of Seat
- Income to dte ($)
- Income that has been recorded against this Employee to-date
- Req Inc rem ($)
- Required income remaining to reach the Employee's Cost of Seat
- Req Each Mnth ($)
- What income is required for each remaining month in order for the Employee to reach their Cost of Seat
Adding or Editing Employee Employment Expense Details
Before adding new employees CHECK that they don't already exist in EP.
To check if an employee already exists in the EP click on the "All Employees" tab as shown.
If your employee exists in the table, you can add them to the financial year you are working on by clicking the link "Add" that appears in the row next to that employee. A form will appear for you to edit their details.
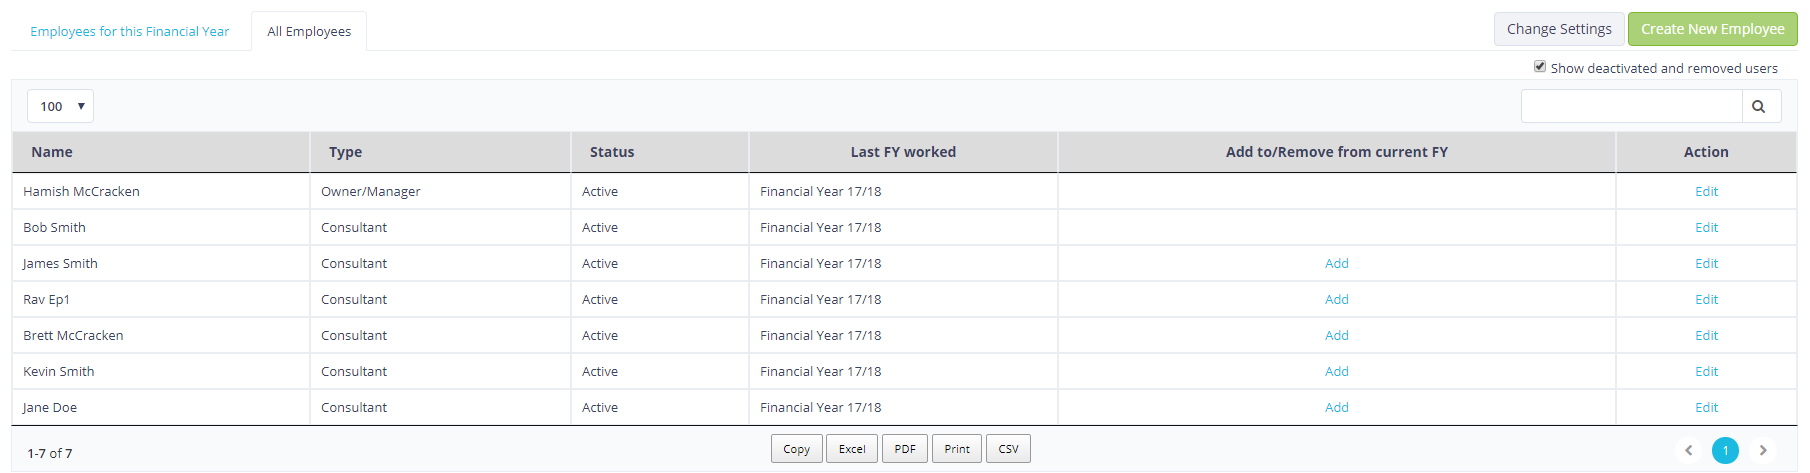
To create a new employee record, click on "Add New Employee".
Enter details as required and click "Save".
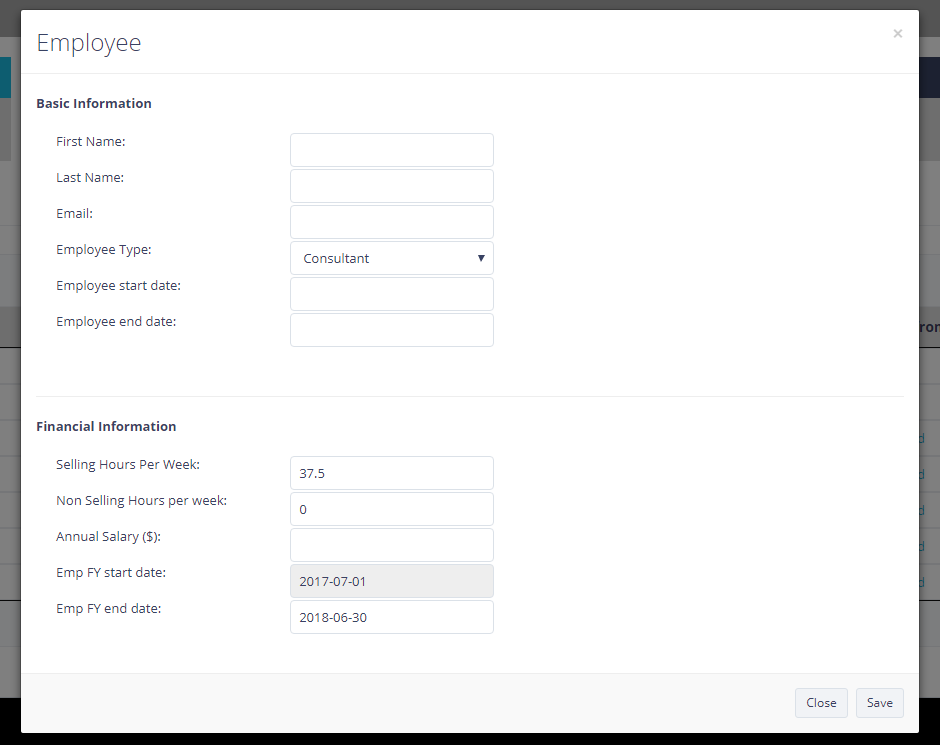
- First Name
- First Name of employee
- Last Name
- Last Name of employee
- Email address that employee uses for their employment
- Employee Type
- The employee's job function
- Employee Start Date
- When the employee commenced work with the business. This must be some date in the past.
- Employee End Date
- When the employee finished employment with the business. This must be some date in the past OR it can be left blank if the employee is still employed.
- Selling Hours Per Week
- Number of hours that the employee is committed to making an income for the business.
- Non Selling Hours Per Week
- How many hours the employee is working on non nicome producing activity such as administrative tasks, marketing, training etc.
- Annual Salary
- The employees, non-prorated annual salary.
- Emp FY Start Date
- What is the start date this financial year. This date is bounded by the 1st of July and the 29th of June in the financial year.
- Emp FY End Date
- What is the end date this financial year. This date is bounded by the 1st of July and the 29th of June in the financial year.
You might consider reducing the selling hours per week for junior consultants to take into account their need for training.
The staff member will now appear on the list. Costs will include a calculated value of Assocaited Costs as well as displaying a "per Month" and "per Annum" breakdown.
If an employee leaves during the financial year, please edit using the "edit" link on the left of the table.
If your employee is a CONTRACTOR, that is, they are not salaried but are either contracted for the hours they work, or work on a commission basis only, then a possible entry would be: enter the number of Selling Hours per Week you think is appropriate and add their salary as zero. When completing the "Sales and Income" data against this employee, subtract the payment to them from the total commission/income they earn and add this value into the Total Gross Commission field. For more assistance around this, please contact your Business Development Manager.
Calculator for Commission Only or Contract Staff
While on the Employment Expenses screen you will notice next to each expense item an "Action" column.
- Click Edit against the appropriate staff member you wish to edit.
- Enter the changes you require.
- Click Save.
You will now see your adjusted staff details in the table.
The Sales and Income Screen
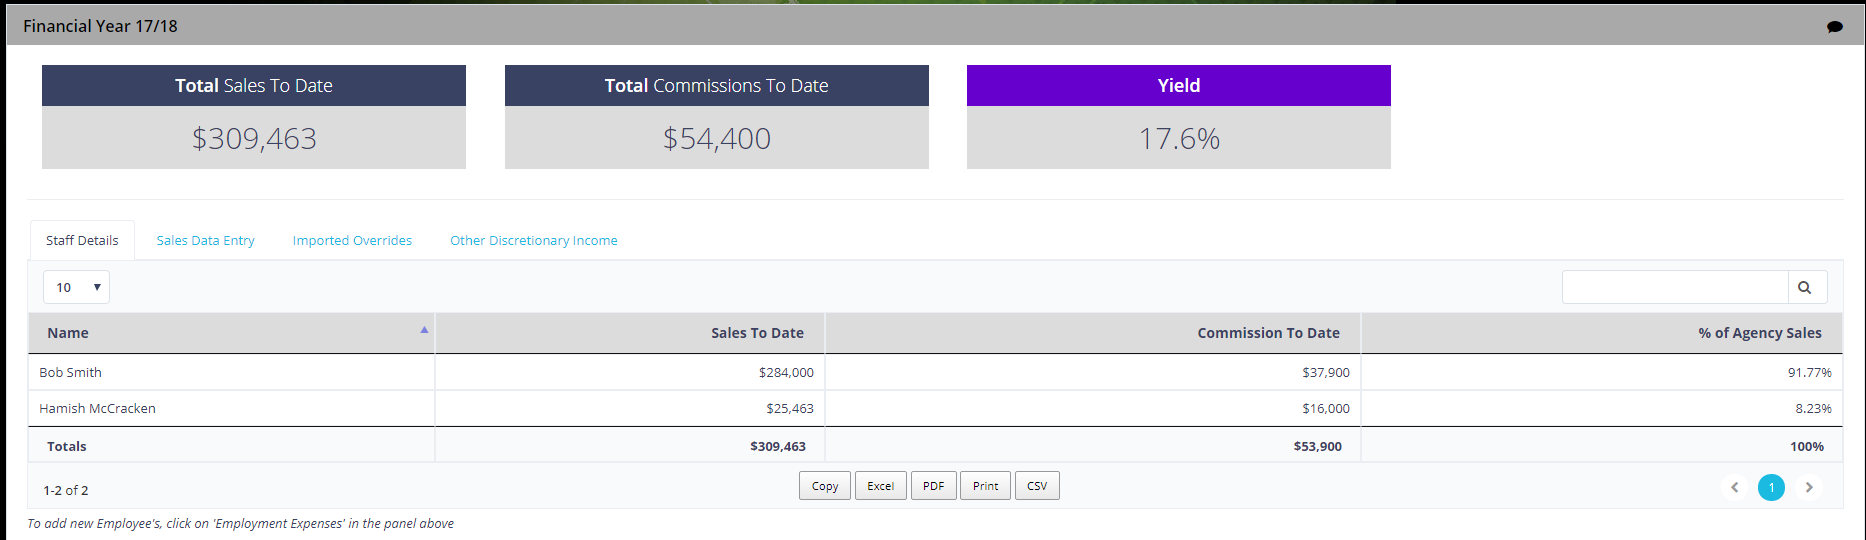
The Staff Details tab
When you first enter the Staff Performance Screen you will be in the Staff Details section, which shows a summary of current staff sales entered to-date.
The Sales Data Entry tab
For each calendar month, you will be required to enter sales data within the Sales and Income Screen. This is very important as it contributes to the ROI calculation screen for your agency as well as the dashboard metrics.
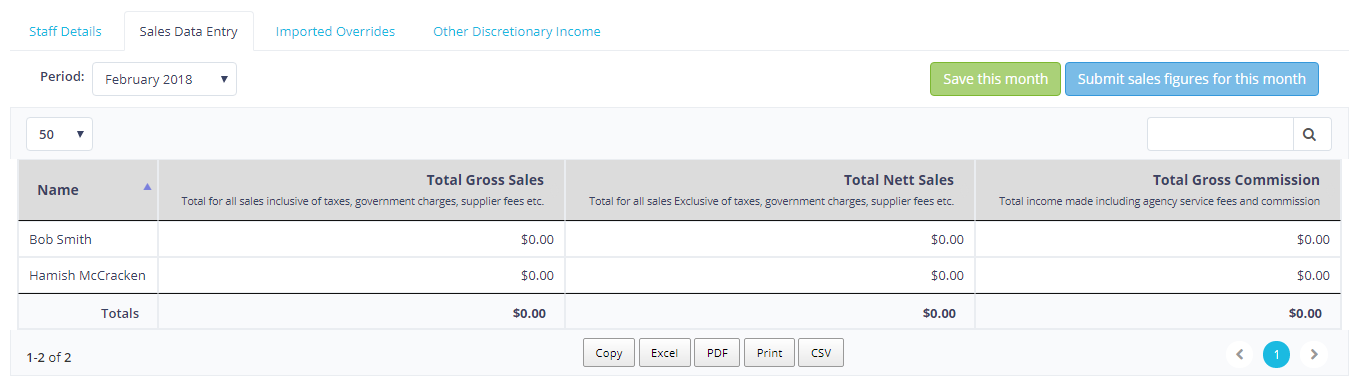
- Name
- The Employee's name
- Total Gross Sales
- The Total Transaction Value (all sales) recorded against the Employee's profile for the corrosponding month. This includes all productive and non-productive (taxes and fees etc) sales made by the Employee.
- Total Nett Sales
- The Total Transaction Value (all sales) MINUS (-) NON-PRODUCTIVE sales (external taxes, fees, surcharges, merchant fees, port charges etc) recorded against the Employee's profile for the corrosponding month.
- Total Gross Commission
- Income generated by the Employee. It may include your business' service fees etc.
Calculator for Commission Only or Contract Staff
To load the data into the table, click into a table cell and type. To move to the next cell, you can press tab on the keyboard (similar to an Excel spreadsheet).
Before leaving the page you must click "Save the Month" for the data to save.
Once you are satisfied that the data entered is correct you MUST submit the data by pressing the "Submit sales figures for this month" otherwise it will not be used in any calculations.
Where and how do I get this data from?
To access the correct data to load into EP from your Customer Relationship Management (CRM) system, otherwise known as a Mid Office System, (such as SAM, Tramada, Travelog or Cross Check Travel) please follow these instructions.
SABRE AGENCY MANAGER (SAM)
Report to run is called "Consultant Summary".
- Log into SAMS
- On the top menu bar go to report and select "Consultants"
- On the new screen there will be tabs on left of screen, go to Commissions and select the report called "Consultant Summary"
- Then enter the appropriate date and select report type as "Month"
- Then click button view
- You will then be presented with the report
- The data you need to enter is in the "Sales", "Taxes" and "Yield" columns.
TRAMADA
Report to run is called "Sales Analysis Report".
- Log into TRAMADA
- On the menu select "Old Reports"
- On the left hand side of the screen there is an option that sales "Sales Analysis", click on this hyperlink.
- On this new page on the top menu bar there is a drop down with "Export CSV"
- Select Transaction dates then month and check the months / dates required
- Click the button "Run Report"
CROSS CHECK TRAVEL (CCTE)
Report to run is called "Commission and Profitability".
- Log into CCTE
- Top menu bar go to Reports
- Go to Sales and hover
- Select "Commission and Profitability Report"
- Select "Summary" from the consultant drop down menu
- Enter the correct date period To and From under the filed titled "TRANX"
- Then click view Report button at the bottom of the page
TRAVELOG
- Go to "Management"
- Select "Agency Sales Analysis"
- Select "Agency Sales Enquiry and Reports"
- Select "Consultant"
- Adjust dates as required
- Press "Start"
- Nominate detailed or summary format
- Print either snapshot or report
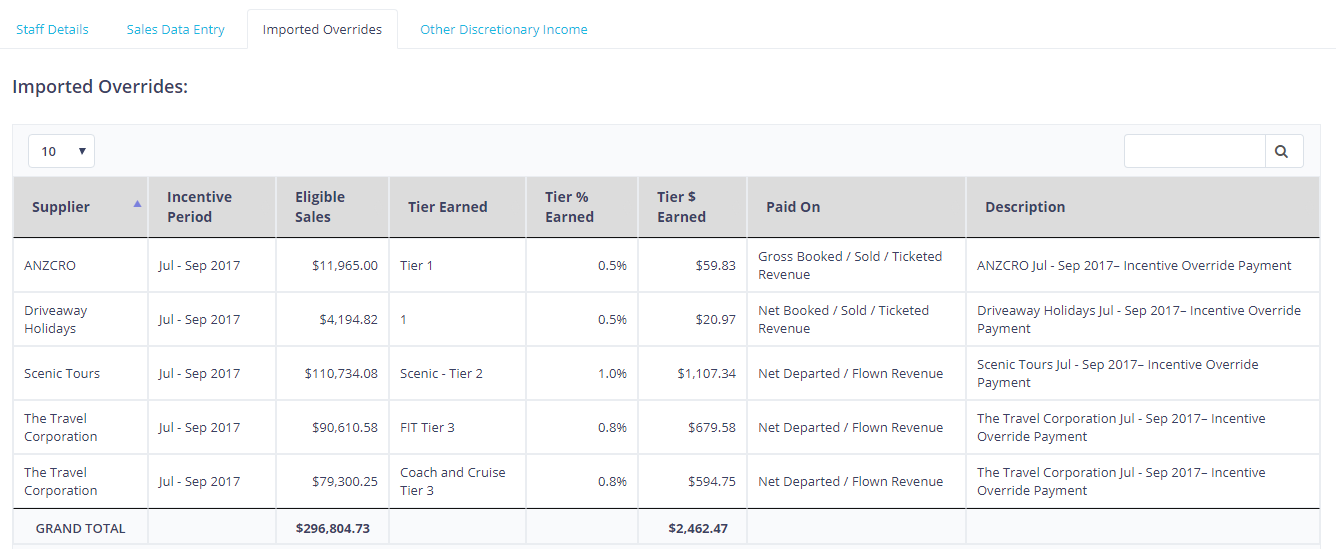
The Imported Overrides tab
Throughout the year you may receive overrides from ETG incentive programs such as Express Rewards and Sell Big Win Big promotions, achieving milestones as per your agreement and other overrides and incentives from suppliers. As these are a contribution to your agency's profitability, they need to be included within EP. These are added by our Accounts Department as per their respective payment schedules.
Other Discretionary Income
Any ancillary income can be recorded here.
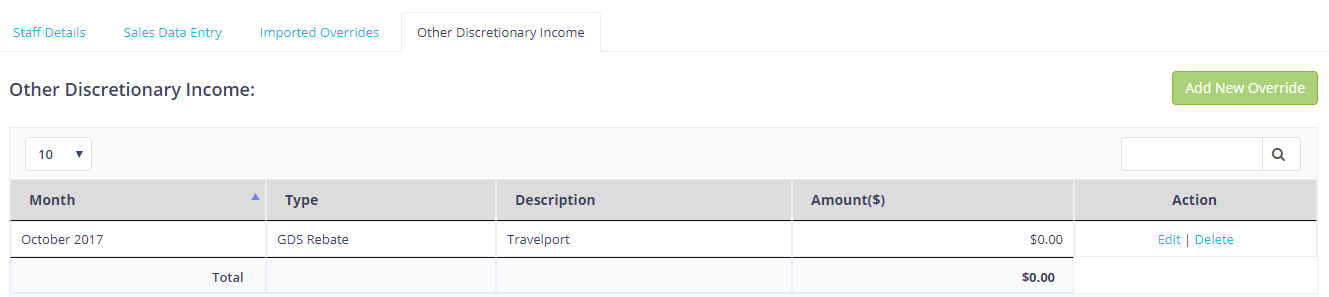
Enter details as required and click "Save".
The item will now appear on the list as well as effecting the ROI calculation.
Edit Override Details
While on the Overrides screen you will notice next to each expense item an "Action" column.
- Click Edit against the appropriate item you wish to edit.
- Underneath the "Overrides" items list, the selected details will appear.
- Enter the changes you require.
- Click Save.
You will now see your adjusted details on the list.
The Reports Screen
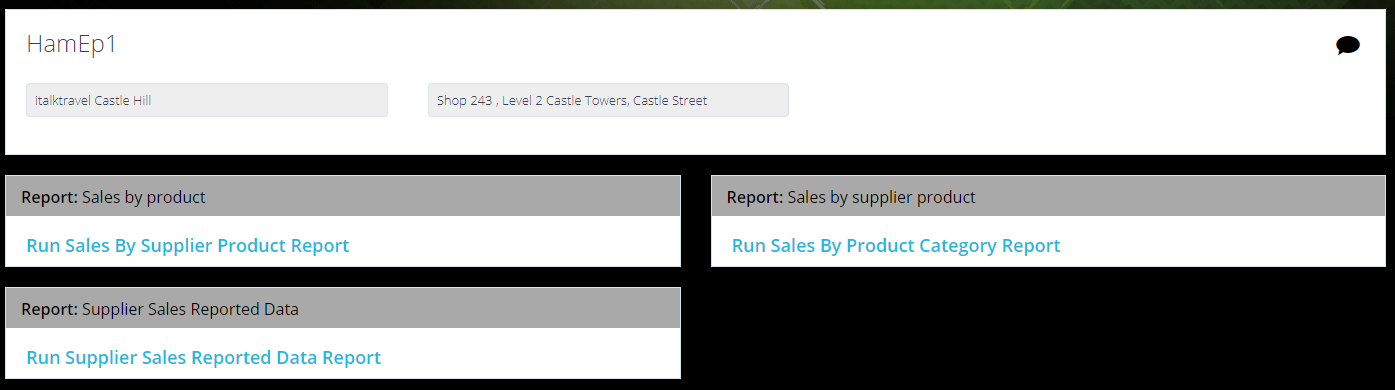
Run a report
- Select the desired report to run.
- Set the appropriate report filters you want to set criteria for, then click Run Report.
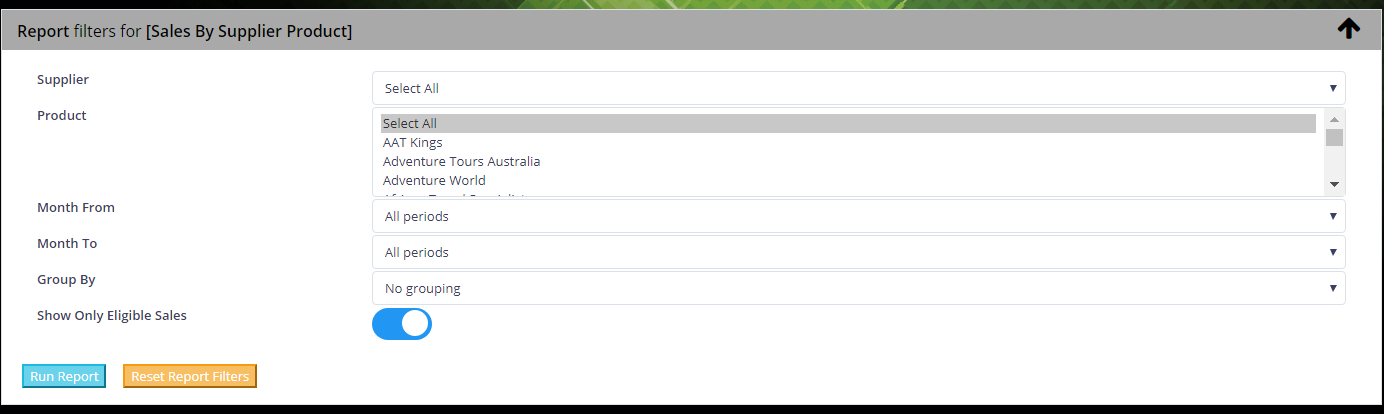
Use the "Group By" filter to reduce the number of rows and produce meaningful results to review.
- The report output will look similar to the below. (If no data is displayed, then no sales have been captured by our Analyst Team for your agency for the filters selected).
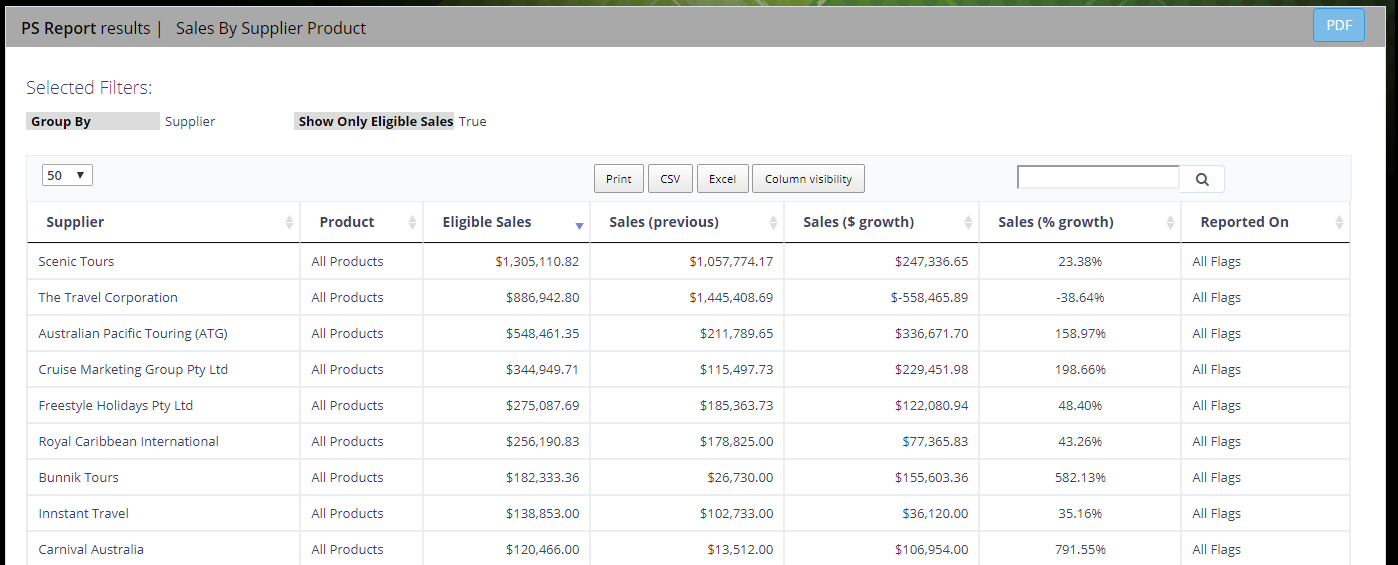
The Column Visibility button, suppresses any columns you wish to "hide" from the report.
After clicking the Column Visibility button, click on the column name to hide that column from the report. By clicking on the column name again it is enabled.
Most suppliers report eligible sales in different ways (e.g. Gross Departed vs Net Departed or even on Booked Pax!). This report will show the sales amount in the appropriate column(s) for that supplier.
Exporting reports
You will be able to export the report in various formats. Note the "green" box highlighting the options below.
- Copy
- copies results to the clipboard. By doing a "paste" command, you will then be able to copy the report results to the body of an email for example. The results may not format correctly and therefore be hard to read, however for smaller result sets this would be appropriate.
- CSV
- copies the report to a "comma delimited file" usually opened via Excel. Formatting is deleted during this process and raw data is visible. Very useful for working with larger report outputs where you wish to import into another spreadsheet.
- Excel
- the most popular report output as within Excel, it is quite easy to work with data.
- creates an Adobe pdf document.
- prints the report to a printer connected to your PC.
Different printers have different settings. You need to ensure landscape setting is selected and it would help to suppress any columns with zero values to ensure the report output to printer is suitable.
Filtering results within a report
For larger report outputs, you are able to filter results within the report.
You can do this by simply entering relevant text to filter in the box provided.
Example below: the user has filtered the report to only show "Excite" sales.
By clicking on the word to delete, the report results are reinstated.
Comparing EP's Reports with Your CRM's or Mid Office System's Reports
It is a good idea to review your CRM or Mid Office System. Below are methods to extract supplier (or creditor) reporting to determine consistency between the reports we are given from suppliers and what your CRM shows.
Please check the eligibility criteria of each supplier you are checking against using the preferred partnership override incentive scheme document.
SABRE AGENCY MANAGER (SAM)
- Go to REPORTS
- Then select MANAGEMENT
- Then select SUPPLER
- Then select SUPPLER COSTED SALES
- At the bottom of the page there are filters that can be used to sort data in different ways depending on the eligibility criteria of each supplier.
TRAMADA
- Go to Reports
- Then select DASHBOARD
- Then select SALES ANALYSIS DASHBOARD
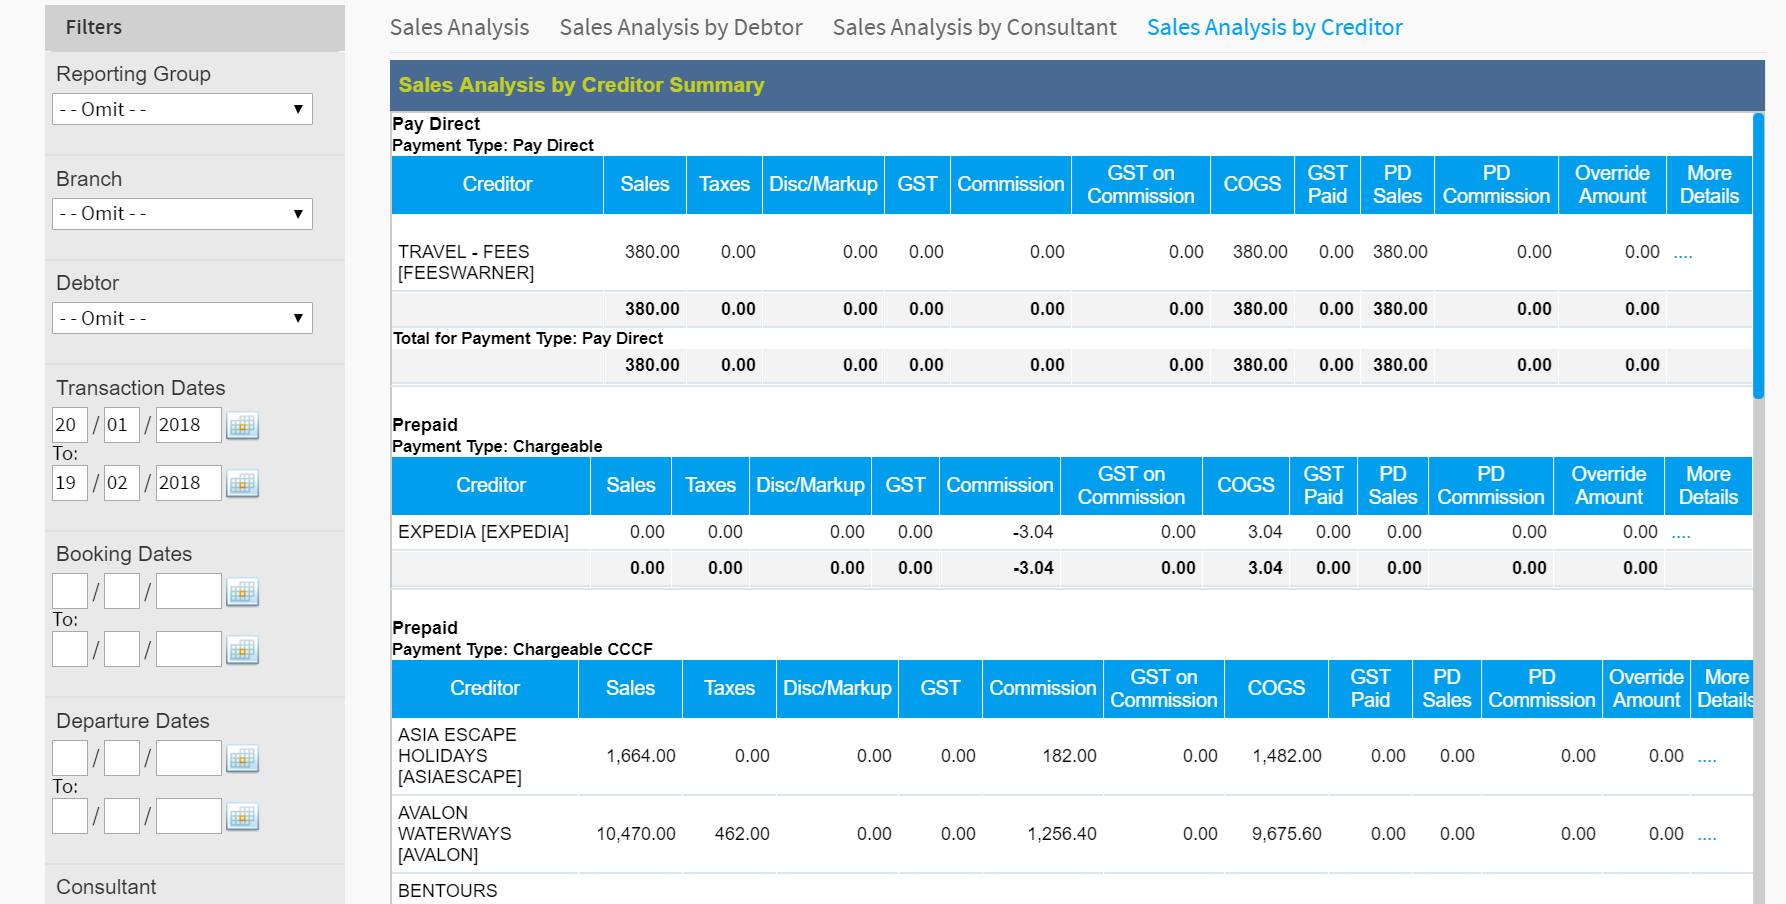
- Then select SALES ANALYSIS BY CREDITOR
You can then put in criteria such as departure and return date/transaction date, supplier code for a single supplier.
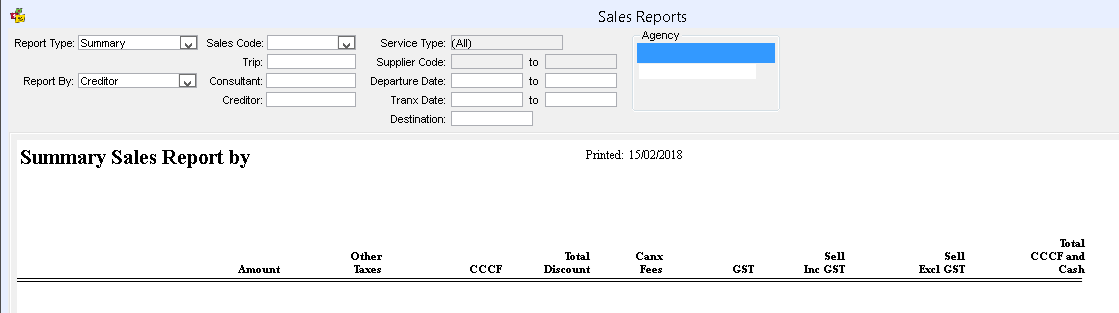
CROSS CHECK TRAVEL (CCTE)
- From the menu REPORTS
- Then select SALES
- Then select SALES REPORTS
- In the form select Report Type: Summary, Report By: Supplier Code
- In the form select the DEPARTURE DATE FROM & TO
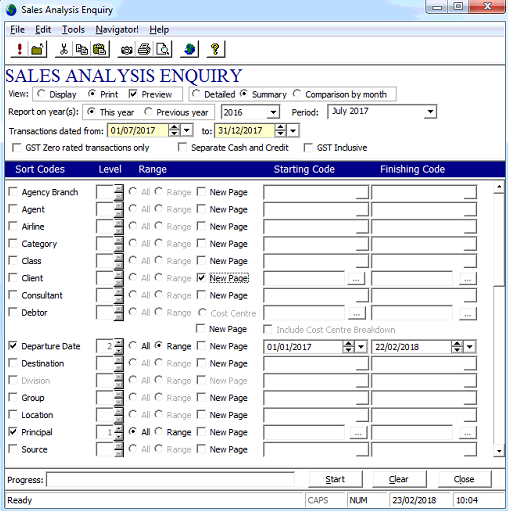
TRAVELOG
Step 1
- Click on Management tab along the top of the main black screen
- Click Agency Sales Analysis – Agency Sales Enquiry & Reports
Step 2
- In this screen enter your transaction date range
- Ensure you click print and tick preview
- In the parameters below select 1. Principal
- Select 2 Departure date and tick range
- Enter the date range as 01/01/1990 to today’s date
What you need to do
This is a simple check list for how you should use EP:
Annually
You may need to modify these entries if they significantly change, such as when an employee ends their employment.
- Work out your ROI and enter it into the ROI page.
- Add in your business Expenses. These need to be considered as budgetary, that is, what your cost expectations are for the financial year. You can use your previous Profit and Loss statement and add a reasonable percentage on, however, it's best if you perform and apply an actual budget process to this data.
- Complete the Employment Expenses: add employee details including their salary, non-selling and selling hours per week, start and end dates of employment for this financial year.
Monthly
Enter Sales Data for each month. So, for example, when in February, you can add January's Sales Data. Sales Data is Total Gross Sales, Total Nett Sales and Total Gross Commission.
Quarterly
Review supplier data in EP against your CRM or Mid Office System to ensure its consistency.
Feedback and trouble-shooting
Please contact your local Business Development Manager with problems and feedback on how we might be able to improve EP.